Political Theatre Drives Market Recovery
President Trump's rapid reversals on China trade policy have created significant market whiplash alongside Bitcoin's spectacular 25% rally. Since bottoming at $74.5K on April 8, Bitcoin has surged back to $93.5K, reclaiming the Short Term Holder Cost Basis despite ongoing policy drama. Trump's shifting stance on Fed Chair Powell – from threatening termination to confirming retention – alongside Treasury Secretary Bessent's private assurances to Wall Street that trade tensions would "de-escalate" have generated extreme two-way volatility. This policy uncertainty has accelerated a shift away from US equities, with the S&P 500 underperforming global peers by the widest monthly margin in 32 years. Meanwhile, gold extended its rally to briefly top $3,500/oz as the "Trump trade" morphs into a "sell-America trade."
TLDR: The recent political theatre from the Trump Administration is driving capital toward neutral reserve assets like Bitcoin.
Is Bitcoin's Decoupling Underway?
Bitcoin's correlation to traditional assets has shifted noticeably over the past 30 days. The BTC-S&P correlation has weakened to 0.5 while the BTC-Gold correlation has strengthened to 0.42, potentially signaling the early stages of a more significant realignment. Most notably, BTC-USD correlation has flipped negative to -0.18, though we caution that correlation regimes tend to be unstable during periods of high volatility. While Bitcoin has historically traded as a high-beta tech proxy, these correlation shifts align with our hypothesis that Bitcoin could eventually achieve de-correlated status similar to gold, though this transition would likely unfold over a much longer timeframe than 30 days.
TLDR: Recent correlation shifts suggest the potential beginnings of Bitcoin's path toward becoming a crisis hedge.
ETF Inflows Driving Price Recovery
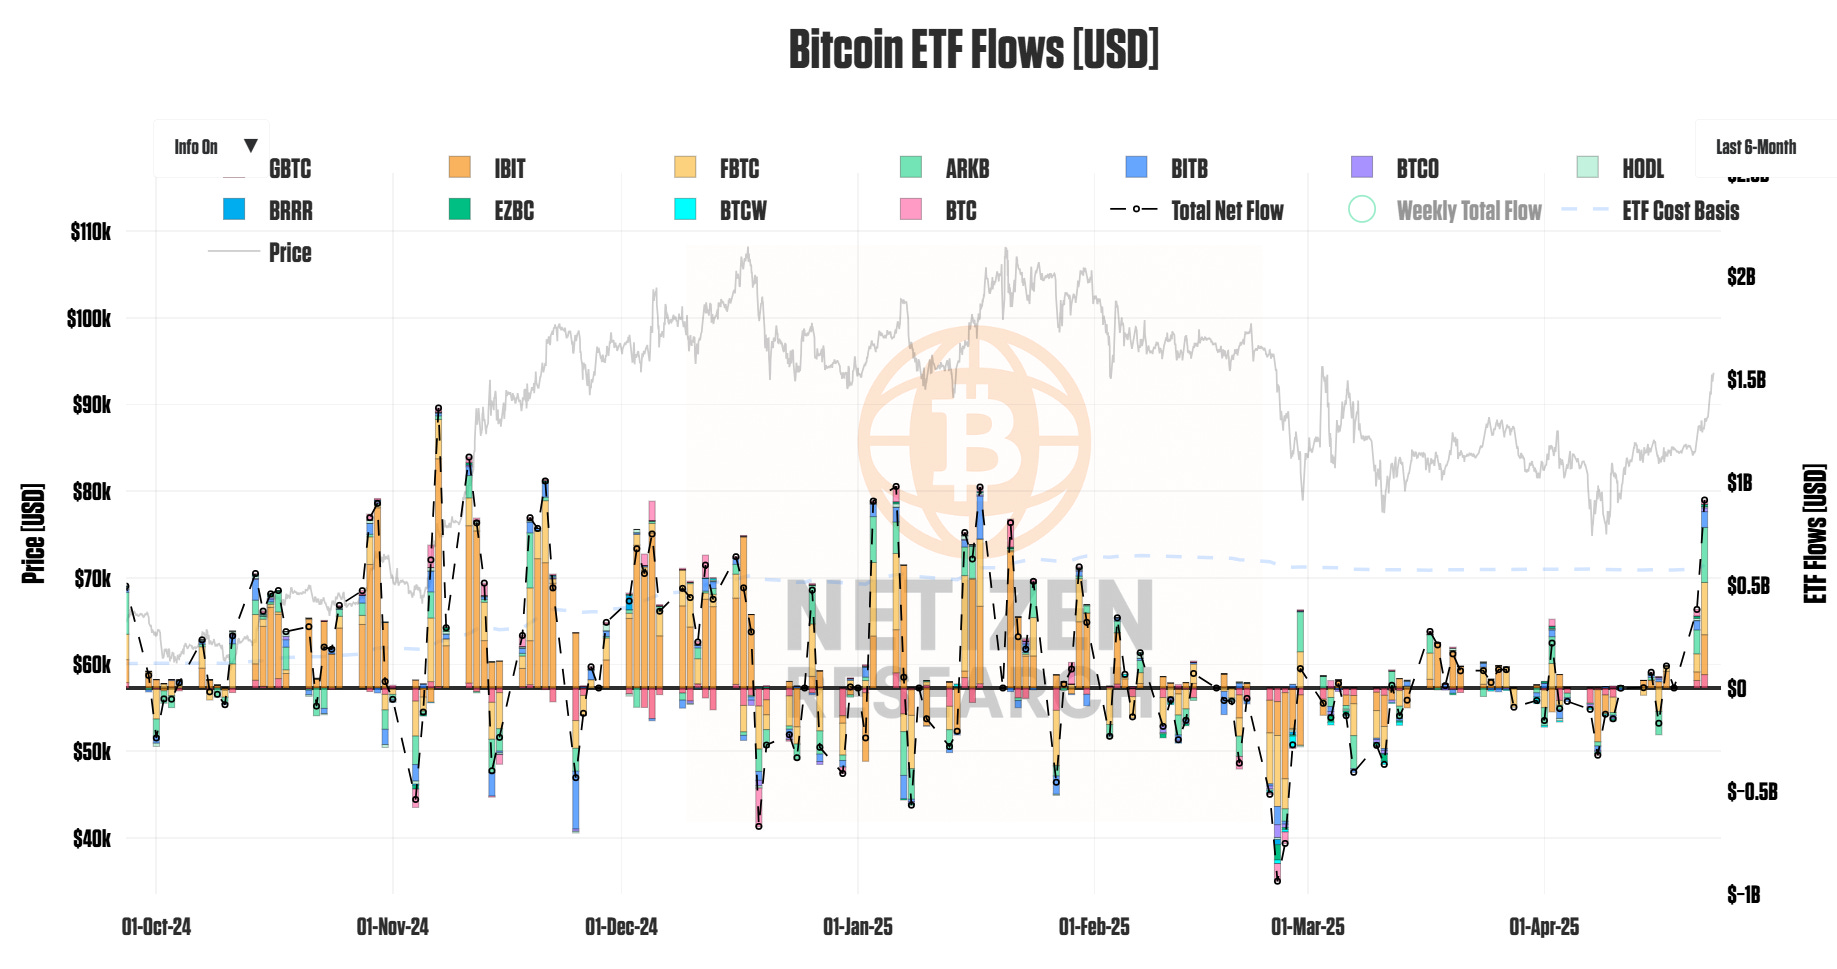
Bitcoin ETFs recorded their largest single-day inflow since January, with a massive net positive flow of $912M yesterday. This remarkable capital injection represents the highest inflow since January 17 (+$975M), which coincided with Bitcoin's previous peak around $102K just before Trump's inauguration on January 20. IBIT, FBTC, and ARKB accounted for the majority of the recent inflows, signaling renewed interest from both retail and institutional investors. The GBTC outflows have diminished to negligible levels, removing a significant headwind that pressured prices throughout Q1.
TLDR: The resurgence in ETF demand signals that sophisticated investors view the recent correction as a compelling entry point.
Caught Between Bulls and Bears
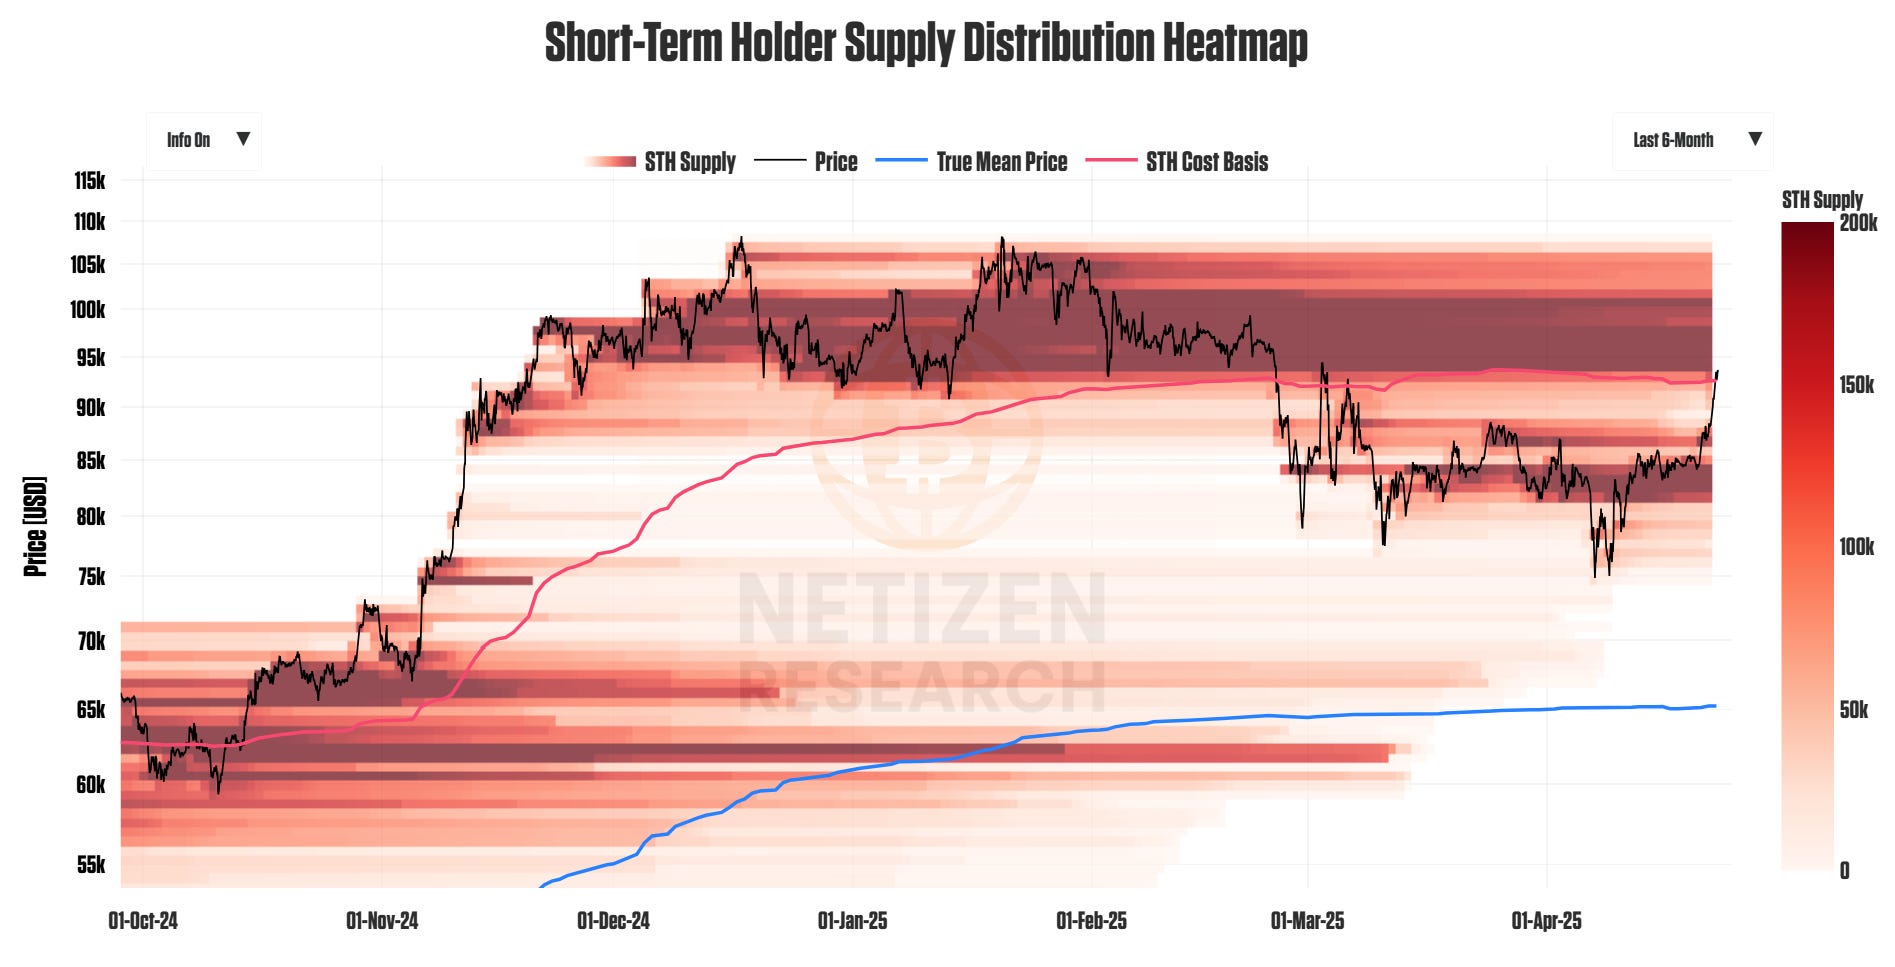
The Short-Term Holder (STH) Supply Distribution heat map reveals significant supply concentration both above $94K-$102K and below $85K-$80K, suggesting Bitcoin may remain range-bound until broader macro uncertainty resolves. While price has reclaimed the STH Cost Basis at $92.6K – a necessary first step for bull market confirmation – we would need to see a successful retest of this level as support following any pullback to gain conviction. This technical picture aligns with our fundamental concern that it's challenging to envision Bitcoin entering a sustained bull market while the broader market regime remains deflationary and the macro environment stagflationary – both historically unfavorable conditions for stocks and Bitcoin.
TLDR: Bitcoin's recovery above the STH Cost Basis suggests a local bottom, but overhead supply remains a significant hurdle.
Short Squeeze or Sustainable Rally?
The recent price surge has been accompanied by substantial short liquidations, raising questions about the sustainability of this move. A concerning pattern has emerged with consecutive days of significant liquidations: $81.9M on April 23, $158.6M on April 22, and $36.8M on April 21 in net liquidations. This concentrated period of short squeezing represents the largest such event since October 26, 2022 (-$206.8M) – ominously, just 2 weeks before the FTX collapse triggered a broader market meltdown. While liquidations provide short-term price fuel, they often mask underlying market dynamics and can create false signals about genuine demand.
TLDR: The heavily liquidation-driven nature of this rally demands skepticism about whether this represents organic accumulation.
Leverage Growing to Concerning Levels
The futures Open Interest versus 7-day Price Change quadrant analysis reveals a troubling trajectory over the past few weeks. Two weeks ago, we observed an encouraging transition from leveraged sell-off to leveraged rally and then to spot rally – a pattern normally associated with sustainable moves. However, rather than seeing continued spot buying, we've now moved back into the leveraged rally quadrant with even greater extremes. The latest data point shows a concerning 13% increase in Open Interest accompanied by a 10% increase in price over the past 7 days. This excessive leverage accumulation, combined with the previously noted short liquidations, reinforces our cautious stance on Bitcoin's near-term prospects despite our long-term bullishness.
TLDR: The current leveraged rally requires confirmation from spot demand to validate a genuine trend reversal.
Valuation: Fair but Not Cheap
Zooming out to assess Bitcoin's valuation following the recent move provides important context for potential future price action. Relative to its True Market Mean price, Bitcoin currently sits at a z-score of 0.7 – placing it at the upper end of fair value territory, but not yet in overvalued range. For perspective, we generally wouldn't consider Bitcoin euphoric or significantly overvalued until it exceeds a z-score of 1.5, which remains considerably higher than current levels. When Bitcoin peaked last November above $100K, the z-score registered approximately 1.4, correctly signaling overvaluation. This metric has proven remarkably reliable through market cycles, including during the FTX collapse in 2022 when Bitcoin traded at a z-score below -1.5, indicating significant undervaluation.
TLDR: Current valuation metrics suggest room for further appreciation before reaching truly extended levels.
Bottom Line: Bitcoin's fair valuation, strong ETF inflows, and potential decoupling from US assets are encouraging, but the unfavorable market regime, Trump's political theater, and excessive leverage suggest caution before declaring a new bull market.
Your Edge in Bitcoin Accumulation
Our Dynamic DCA model has historically outperformed traditional dollar-cost averaging by ~30% over multi-year periods. For just $10/month, access our premium research and rigorously back-tested accumulation strategy that adapts to market conditions using on-chain data, helping you stack Bitcoin smarter.
In the coming weeks, we will also be creating a new chart suite and investor dashboard exclusive to premium members, giving you a full recap of macro and on-chain metrics we're seeing and opportunities in the market. Your support helps fund this development! Consider subscribing.
Thanks for reading this week's note! See you next week – and as always, hit reply if you have any questions, comments, or suggestions!
Take care -Brian
Disclaimer: This newsletter is for informational purposes only and should not be considered financial advice. Always conduct your own research and consult with a qualified financial advisor before making investment decisions.


