


Higherer for Longerer
The Fed Will Need To Do More

Transitory Goldilocks Is Dead
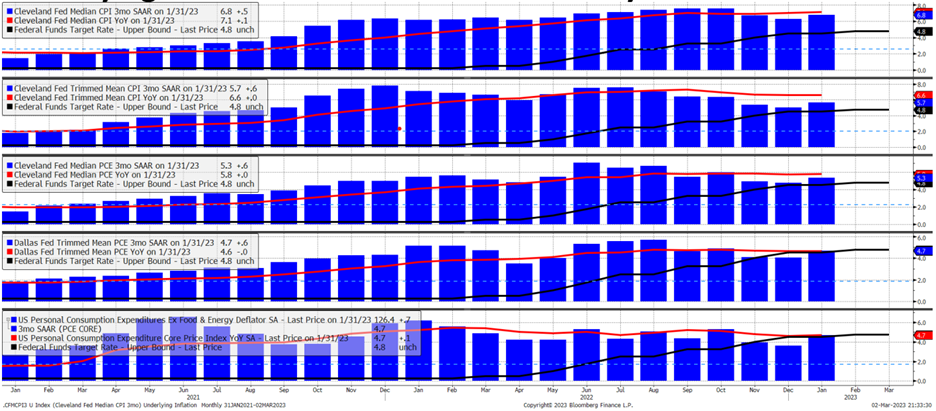
After a strong January for the S&P 500 (+6.2%) and Bitcoin (+39.9%) driven by transitory goldilocks, both assets meandered in February (-2.6% and flat, respectively) following hotter-than-expected labor market and inflation data. Specifically, median CPI on a 3mo SAAR basis reaccelerated to +6.8% (and even accelerated on a YoY basis!), well north of the Fed’s 2% inflation target. This is a red flag for the Federal Reserve, whose “data-dependent” reaction function will adjust to even higher interest rates for even longer than consensus previously expected.
As we’ve communicated in prior letters, a resilient US economy = resilient US inflation. It’s unrealistic for the U.S. to enter a recession with a structurally tight labor market, wage inflation, and household/corporate balance sheets flush with cash. We are slowly coming to the view that the Fed (and western central banks) cannot stop inflation even if it did cause a recession. Although the Fed is raising rates to stop demand/lending-driven inflation, higher rates will paradoxically exacerbate U.S. fiscal deficits and create deficit-driven inflation. This is characteristic of emerging markets before they enter an inflationary depression and currency crisis. The political narrative in NATO countries is such that citizens are suffering from inflation, therefore the government must do more. However, the irony is that fiscal support will only add fuel to the inflation fire. Since last year our view has been that Russia’s invasion of Ukraine is a strategic geopolitical move to trigger a Western sovereign debt crisis – an outcome that would also be in China’s best interest…time will tell.
It's important to respect that the real economy is a slow-moving machine. Financial markets on the other hand will constantly try to interpret and front-run incremental economic data causing volatility. While we are currently modeling the real economy to be in DEFLATION by mid-year, financial markets may be fickle in the interim. As it currently stands, we expect markets to be volatile and range-bound in 1H23 before a material de-risking in 2H23.
Source: 42 Macro
Base Case - Fed Funds to 6%
The most recent economic data poured cold water on the “immaculate disinflation” narrative, as we now expect the phase 1 liquidity cycle downturn to extend further into mid-2023. Notably, on 3/22 the Fed will update its summary of economic projections where they will estimate future growth, inflation, unemployment, and interest rates. In particular, we’re focused on what the Fed estimates for terminal interest rates.
Recall, in December 2022 the Fed projected terminal interest rates would reach 5.1% by the end of 2023. However, up until early February, the market was in denial, only pricing in 4.8% as the terminal interest rate. Following the hawkish January labor market and inflation data, the market is now expecting interest rates to peak at 5.4% in August 2023, well beyond the Fed’s prior estimate. While investors will try to front-run Fed policy as incremental macro data points are released throughout the month, we expect the 3/22 FOMC meeting will be a turning point for markets.

Source: Bianco Research
Our view is that the phase 2 credit cycle downturn and recession will be a late 2023 event at the earliest. The reality is that U.S. households and corporations are flush with cash. Yes, inflation is making life more difficult for lower-class demographics, but in the aggregate, the U.S. economy is the richest it’s ever been – with household cash ($7.9 tn), corporate cash ($2.3 tn), and household net worth ($143.3 tn) at all-time highs. There is simply too much capital sitting on the sidelines for demand to slow down materially.
For the Fed to achieve 2% inflation, wage growth must decelerate. However, to reduce wage inflation, nominal spending and income growth need to get cut and unemployment must rise. And to raise unemployment, nominal GDP growth needs to be driven below wage growth and compress profit margins which will cause corporate earnings to decline. Once that is achieved, historical inflationary periods show that the Fed would need to hold interest rates steady for anywhere from 12-18 months until wage growth, inflation, and real growth all converge around 2%. Again, this interest rate cycle could take years to unfold.
Our point is that the Fed has a lot of work ahead of itself. And while this isn’t over any investable time horizon, our view is that the Fed will eventually capitulate on their 2% inflation target and raise their target to 3%. This would be catastrophic for the treasury market, but a problem and discussion for another day.

Source: 42 Macro
Bull Case - China + Japan Stimulate the World
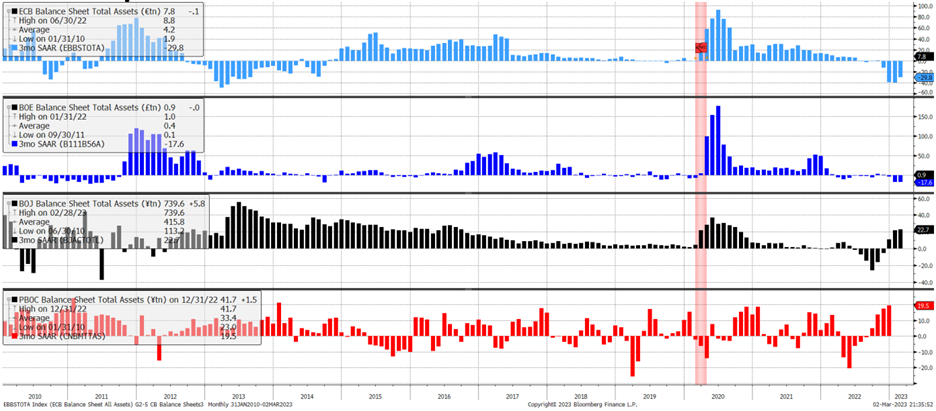
We continue to believe $4,200 on the S&P 500 is the upper bound of this most recent bear market rally. Although China and Japan have been expanding their balance sheet at +19.5% and 22.7% on a 3mo SAAR basis, it has not been enough to offset the monetary tightening from the U.S., Eurozone, and Bank of England. We would also note that Kazuo Ueda will start his role as the next governor of the Bank of Japan in April, succeeding Governor Kuroda (a historic dove). If Governor Ueda decides to change the BOJ’s monetary policy in April, Japan could pivot from stimulating to contracting in several months, leaving China as the lone Central Bank easing monetary policy.
Furthermore, the January rally was fueled by a weaker USD, which bottomed on 2/2 at 100.8. Since then, the USD has rallied over 3%, getting above its 50% Fibonacci retracement level, causing pressure on risk assets. While we’re apprehensive to “predict the predictor,” the USD is a powerful gauge for risk-on/risk-off conditions. If the USD can consolidate and go higher, this would put further pressure on risk assets. However, interest rate differentials suggest the USD is properly valued relative to other foreign currencies, which could put a cap on USD strength and potentially be supportive of financial markets. All that said, we do not yet think the cycle bottom is in for risk assets.
Source: 42 Macro
Bear Case - Recession Incoming
While a phase 2 credit cycle downturn may materialize earlier than consensus expects, we consider this outcome to be low probability. The U.S. economy has become hyper-financialized compared to historic business cycles. U.S. manufacturing only makes up 14% of the labor market and 18% of GDP. On the other hand, the U.S. services sector makes up the balance. Unless we see a material slowdown in services consumption and labor wages, the economy will remain resilient, and inflation will persist. Anecdotally, I also own a higher-end boutique gym in NYC and am experiencing all the above in real time.
Furthermore, it’s important to understand that every recession in history begins with a phase 1 liquidity cycle downturn and ends with a phase 2 credit cycle downturn. While the phase 1 liquidity cycle downturn is still being repriced, there has been zero market evidence of a pricing-in of a phase 2 credit cycle downturn. Suggesting to us that the worst is ahead of us…just not anytime soon. We currently don’t see any credit risk in the economy, but may begin to see some cracks as we approach the end of the year.

Source: 42 Macro
Be Patient With Bitcoin
We ended last month’s letter by saying, “we suspect the bulls dancing on bear graves will soon find themselves in the same plot of dirt later this year.” The exuberance that took BTC from $16K to $25K seems to be losing steam, as hopes for China stimulus and a Fed pivot seem to be disappointing bulls. Our analysis of 17 bear markets going back to 1929 shows that on a median basis the S&P 500 bottoms one month AFTER the Fed pivots (either a pause, pivot, or panic). Furthermore, the S&P 500 has only bottomed BEFORE the Fed pivoted three times in history: 1) 2 months before in 1942, 2) 1 month before in 1957, and 3) 1 month before in 1962. Here’s the punchline: unless you think the Fed will pivot in May 2023, there is no reason to go all-in on risk assets right now (Bitcoin included).
As it relates to Bitcoin specifically, we believe there are times when you should break the rules – particularly during an idiosyncratic price dislocation, as we saw back in late 2022 following massive institutional capitulation from FTX’s collapse. Learning from our mistakes, on-chain data should be prioritized to spot market extremes, even if the call is contrary to the current macroeconomic environment. We want to introduce one such tool to help identify Bitcoin tops and bottoms called Market Value to Realized Value (MVRV).
MVRV is the ratio between BTC’s market price and the average cost basis at which every coin last moved on-chain. When MVRV = 1, that means the market price of BTC is equal to the average cost basis, or realized price. Based on the MVRV ratio we can start to categorize different BTC environments:
Cycle lows (blue) form when MVRV < 0.8 (~5% of trading days below)
Capitulation starts (green) when MVRV < 1.0 (~15% of trading days below)
Euphoria starts (yellow) when MVRV > 2.4 (~20% of trading days above)
Cycle peaks (red) form when MVRV >3.2 (~6% of trading days above)
As a general rule of thumb, we want to be buying when MVRV < 1 and selling (or hedging, selling covered call options, etc.) when MVRV > 2.4. Given the recent January run-up, BTC is now trading above its realized price of $19.9K. Based on everything we outlined today, our strategy is to begin slowly purchasing BTC on a retest below $19.9K (which is slightly above BTC’s 200-day moving average of $19.7K). This can either be achieved by selling out of the money put options (if implied volatility is high enough) or setting limit orders to buy BTC. In the meantime, however, cash (or short-term USTs earning 4.5%+) is ironically king.
