


Netizen Weekly | Bitcoin Market Update #18
Uncle Sam's Bull Market Machine

Why Markets Are Biased To Go Up
Since the market regime transitioned to RISK-ON (first REFLATION and now GOLDILOCKS) on May 12th, the S&P 500 has gained 3% while Bitcoin has surged 6%—a textbook example of how riskier assets outperform when money and credit expand. While the endless news cycle leaves many investors lost in the sauce, markets are simple: growth and inflation drive asset prices, and the two institutions that matter most are the White House (fiscal policy) and the Federal Reserve (monetary policy). Whoever ends up as the next Fed Chair (currently speculated to include Scott Bessent and others) will be more dovish than current Fed Chair Jerome Powell, signaling easier money ahead. Meanwhile, the White House's spending continues to fuel inequality, with $3.2 trillion flowing to Social Security and Medicare, $1.3 trillion targeting lower-income programs, but $2.6 trillion disappearing into defense, corporate subsidies, and tax breaks that disproportionately benefit the owner class. Trump's proposed $3 trillion "One Big Beautiful Bill Act" would turbo-charge our K-shaped economy, and just like we saw stocks boom during Biden's massive post-COVID spending, asset prices will trend higher.
TLDR: The government's inability to restrain spending will cause the price of stocks, real estate, and Bitcoin to go up over time.
Power Law Still On Track
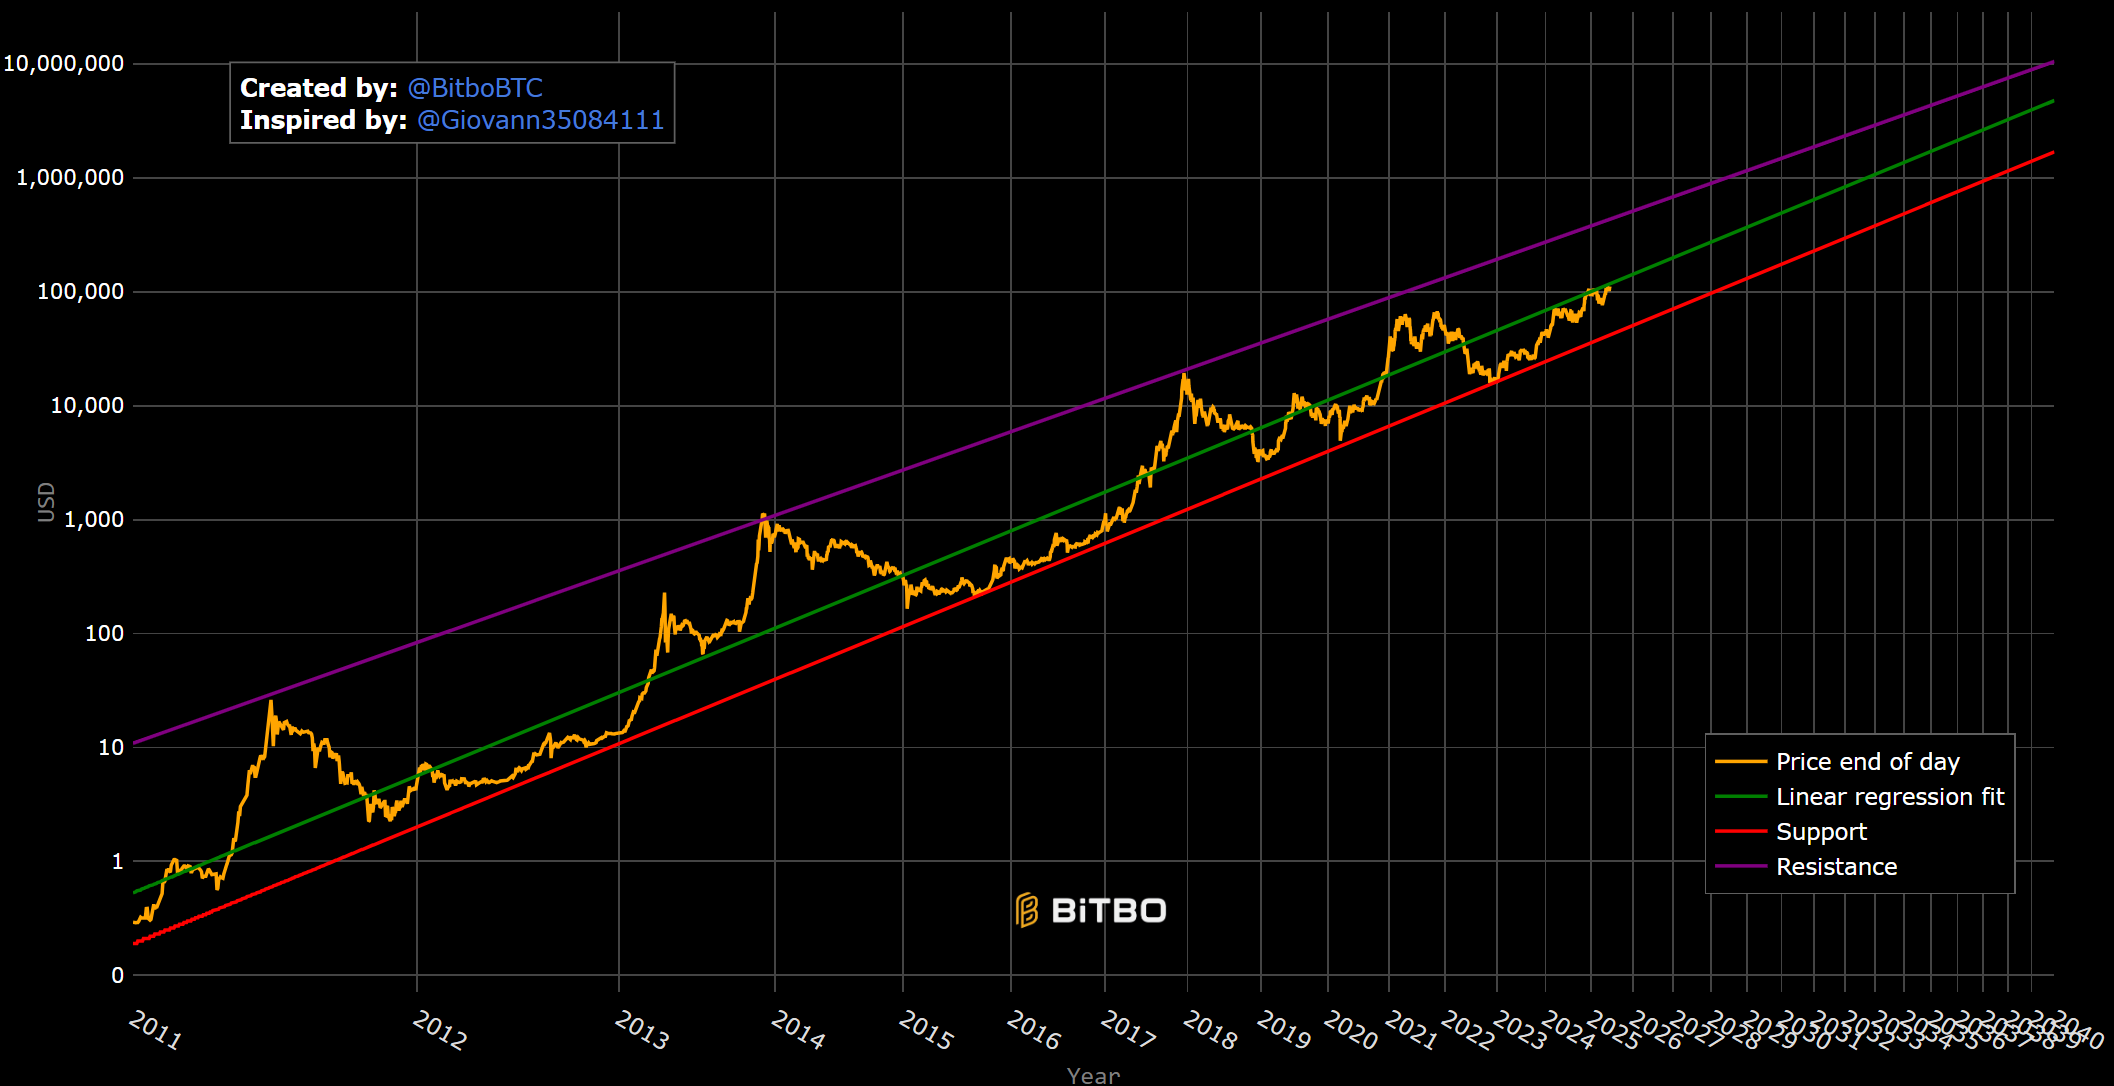
One question I always get is where I think Bitcoin's price is headed. While I don't have a crystal ball, the power-law theory offers a useful framework for thinking through Bitcoin's adoption curve and how that translates to price action. The model shows Bitcoin at $107K against a theoretical fair value of $120K, trading comfortably within historical bounds of $40K-$425K, with projections suggesting $495K by January 2030 (range $175K-$1.5M) and $4.7M by 2040 (range $1.7M-$10.5M). I would caution however that this model is a mathematical description of past trends, not a guarantee of future performance. That said, it could be a useful way to think about the upside potential of Bitcoin.
TLDR: Bitcoin remains undervalued relative to its long-term trajectory, especially as government spending becomes uncontrollable.
Fresh Demand Above $103K

Despite being near all-time highs, we continue to see growing demand above the psychologically significant level of $100K, with 300K BTC absorbed near $105K and heavy clusters around $109K. The biggest selling came from $85K-$103K holders with roughly 55% of the selling pressure originating from these shorter-term traders who bought the earlier dip. New money is confidently stepping in at record prices, suggesting institutional flows are overwhelming profit-taking. This dynamic reflects Uncle Sam's liquidity machine creating enough fresh capital to absorb supply at any level—when dollars are abundant, Bitcoin's scarcity premium expands.
TLDR: We continue to see institutional demand for Bitcoin above $103K, likely raising the price floor.
Diamond Hands Near ATHs

One thing that's standing out to us is how oddly long-term holders are acting with Bitcoin at all-time highs. We normally see LTHers selling near ATHs to capture profit, but this time LTH supply increased by 5.7% over the past month. This pattern historically occurs near market bottoms like September 2024 and June 2021, yet here it's happening during strength rather than capitulation, signaling a structurally different holder base. We suspect the shift means more Bitcoin is moving into "diamond hands" just as Uncle Sam's fiscal engine continues pumping liquidity into markets. When committed holders control more supply during an expansionary cycle, it creates a ratcheting effect that lifts the price floor with each wave of government spending.
TLDR: Despite being near ATH, Long-Term Holders refuse to sell, an atypical behavior for normal bull runs, which we view as constructive for prices.
Shorts Get Steamrolled Again
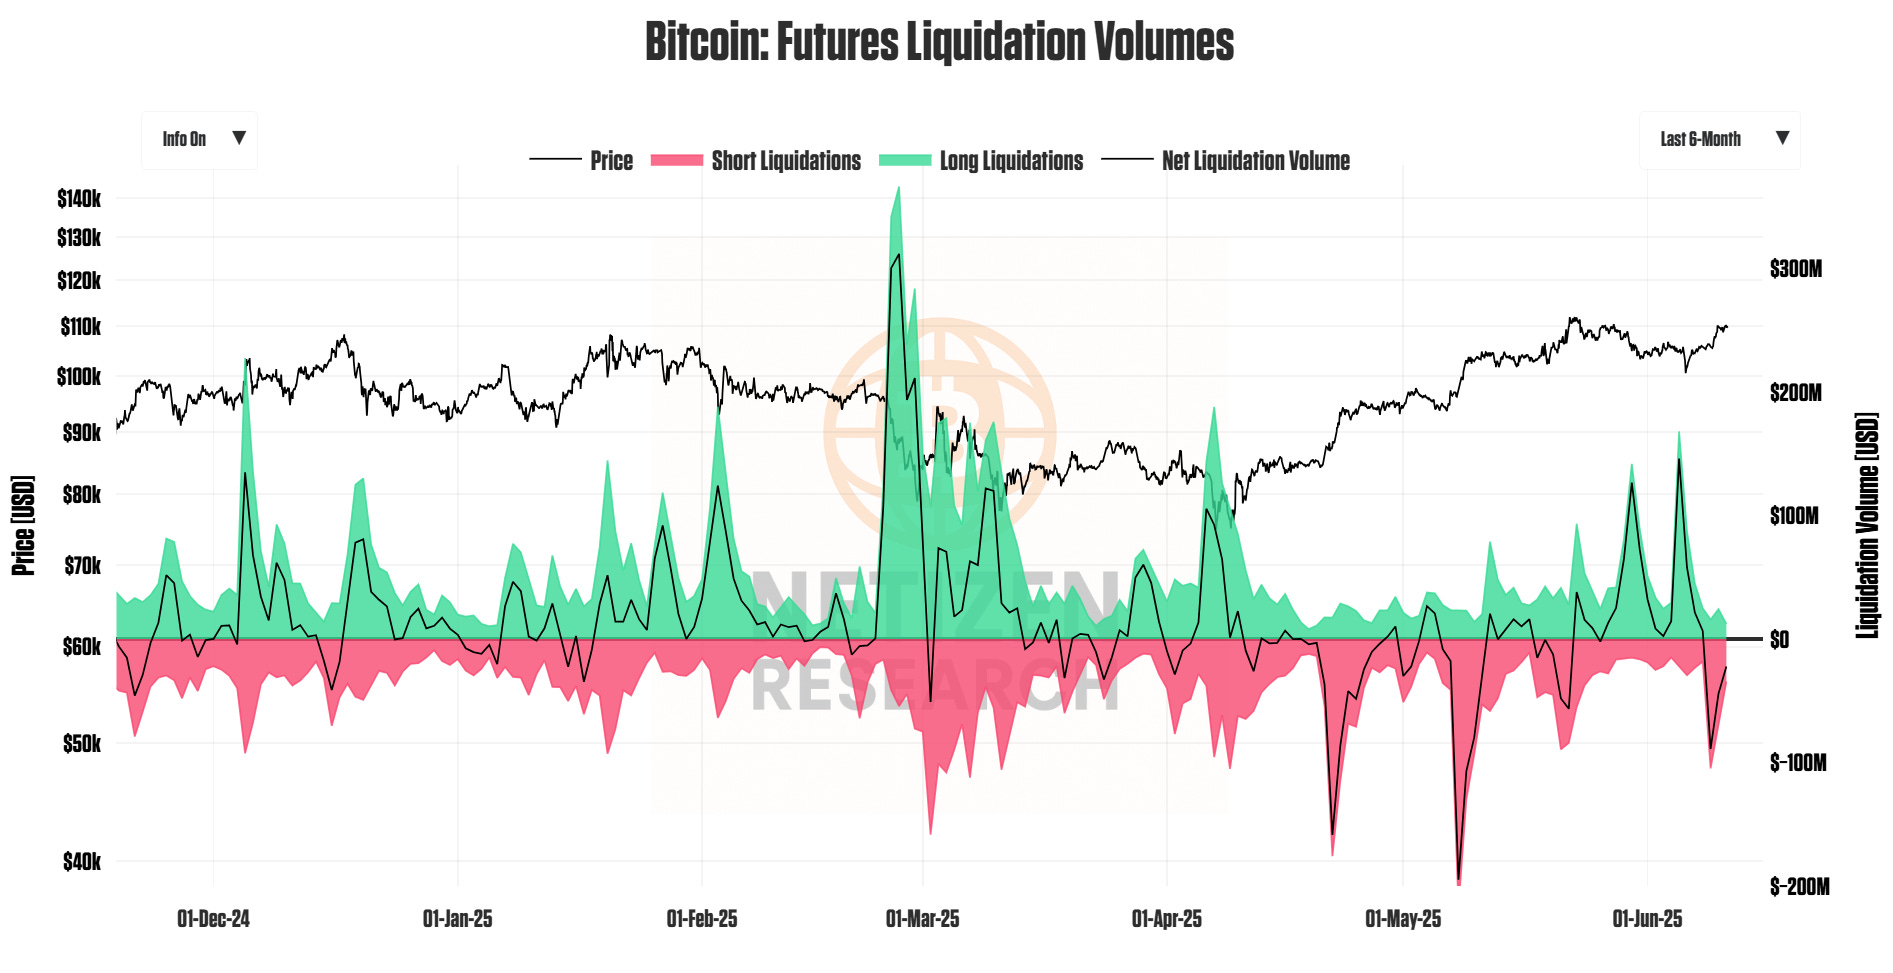
It appears the recent Bitcoin strength was driven more by short liquidations than genuine spot buying, with $105M in forced purchases on June 9th causing prices to rally near $110K in a minor squeeze. Earlier liquidation events this year, $217M in May and $175M in April, produced similar upside moves as overleveraged bears got margin-called. The rally feels increasingly driven by forced buying rather than organic spot demand, yet the underlying macro environment keeps punishing those betting against risk assets. Uncle Sam's spending spree creates a structural bid under all scarce assets, making short positions a dangerous game against the fiscal tide.
TLDR: Recent strength was driven by traders covering their short positions betting on Bitcoin to go down as opposed to genuine spot buying.
Thanks for reading this week's note! See you next week – and as always, hit reply if you have any questions, comments, or suggestions!
Take care -Brian
Disclaimer: This newsletter is for informational purposes only and should not be considered financial advice. Always conduct your own research and consult with a qualified financial advisor before making investment decisions.